When data from an experiment are produced they usually go through several steps of transportation, reformatting, grouping, filtering, and so on, until they end up in some kind of visualization, histograms, curves, tracks, etc. Many of these steps are common to many experiments, others are very specific to only one particular setup. For the pure transportation, highly developed frameworks like MIDAS, usually called the "data acquisition" (DAQ), can be used but for the higher stages, usually referred to as the "analysis", no common solution can be found.
The leitmotiv of the Flow Analyzer is that as much as possible binary code analyzing data from a physical experiment can be re-used and not more than the code absolutely necessary for a particular analysis must be implemented. This means that the main program provides only a basic functionality and the actual analyzer is composed during the run time. Techniques like dynamic loading and linking or symbol lookup are indispensible to achieve this flexibility.
The idea dates back a few years when Jonty Pearson was upgrading TRIUMFs DAQ for the DRAGON experiment and started to separate the part of the analyzer program that never changes (start/stop, skip events, etc...) from the specific part, the "Plugin", for a particular experiment. The analyzer dynamically loads and links the plugin into its own running code. The coding was done in C++, and one plugin in principle represented one C++ object class, though there was only one single instantiation of that class and only one type of class (the analyzer class).
Soonafter, we decided for a more rigorous concept that even parts of the analyzer plugin are plugins, and that the entire analyzer composes itself from that parts when it starts up. These components ("modules", or also "plugins") could have defined interfaces that can be found by dynamic symbol lookup, so there would be no loss in speed compared with a custom compiled ("old-fashioned") analyzer.
So far, none of those concept came to an application for DRAGON but I picked up the code for the "single plugin" analyzer for the TACTIC experiment and developed it. Late 2008 there have been quite a few people from the TACTIC group working on different parts of the analysis and the "single plugin" concept became very complicated to manage. I started to develop also the "multi plugin" concept for TACTIC as described above and January 2009 we used it first time for a real experiment with great success
Soon after using the first versions of a multi-plugin analyzer there turned out to be a problem with the graphical display. Several instances of the same class behave the same way, so if a histogram plugin opens a window with a graphical representation of that histogram, another one does the same, and soon the screen is full with flying windows that belong to any plugins. In the same context there was also the problem that one histogram class is usually connected to one type of histogram, so you need different classes for ROOT histograms or other systems (like custom made histograms or non-graphical histograms). The solution was AIDA, an abstract histogramming (and analysis) interface.
AIDA solves both problems and has even more advantages. AIDA defines a set of classes and functions that can be used for histogramming data, fitting, etc. but there can be different implementations. This means that without changing the histogram plugin in the analyzer, the complete histogramming system can be exchanged, so the analyzer is not tied to any particular system like ROOT. And the implementations usually group the histograms in a single window with a tree browser, so no flying windows anymore. And the AIDA implementation can also come as dynamically loadable module, so it can be loaded and linked with the running code using the same technique as for the analyzer plugins. At the moment, there is only one concrete AIDA implementation that satisfies our needs, OpenScientist. This system comes also with another interface, OpenInventor for 3D visualization.
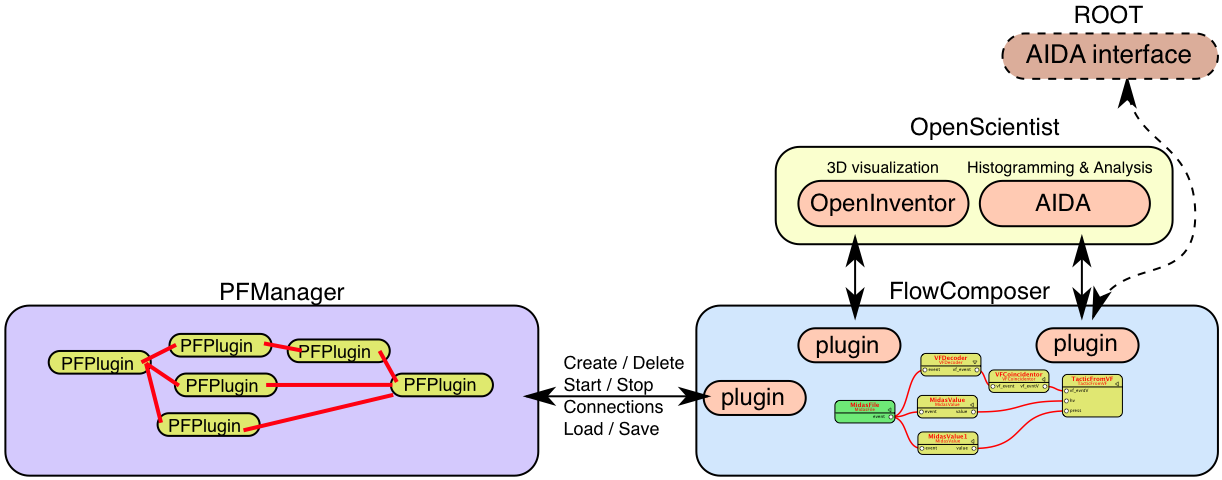
So we have 2 types of loadable code, one big AIDA plugin for the histogramming, hereafter called "AIDA" or "AIDA system", and many small plugins for the different tasks on the data flow which we will call just "plugins" or "modules". (There is also another "big" plugin for OpenInventor and, internally used, for the PFManager.) Each of the plugins can in principle generate and fill histograms using AIDA function calls, though it is recommended to use the ready-made "Histo" plugin for that. The schematics of the Flow Analyzer is shown in Figure 1, “Basic structure of the Flow Analyzer.”
The PFManager object can load and store document files, so-called "pflow" files (they have the suffix ".pflow"), maintains the plugins and their connections, starts and stops the data cycle loop, and more. In the drawing, "FlowComposer" stands for any main program. The main program loads and instantiates a PFManager object for each "pflow" file and loads the AIDA system (and also the OpenInventor system if more complex graphics is needed). Therefore, the main program is mainly a wrapper for PFManager to interface with the user. It can be a simple command line tool or an interactive graphical program. Several main programs are available in the distribution.
The "core" of the implementation uses POSIX functions, in particular to load the plugins and the AIDA system. Therefore, it runs on most UNIX systems. We tested it with Linux (Ubuntu, Mandriva, and Scientific Linux) and Mac OS X / Darwin. A simple command-line program, "flowshell", provides the basic functionality, i.e. load the PFManager and the AIDA system, loads a pflow file, starts the run, and gives the GUI control to the AIDA plotter, if desired. The AIDA system OpenScientist in version 16.10 or higher also runs on these systems, and it successfully dynamically links with flowshell. But we also have advanced applications that allow to edit pflow files graphically. For Mac OS X this is FlowComposer, and for all UNIX systems we have a Qt based application.
The implementation was not quite trivial because the dynamic loading can be complicated if there are nested dependencies of the libraries. But most difficulties came from the threaded programming: To keep the interactivity with the user (updating the histograms, reacting on mouse clicks), several threads must be maintained, in particular the AIDA system must be able to process GUI events and data events in parallel. On our request, the OpenScientist people put a lot of work into this issue to get the AIDA system running this way, so many thanks to this group here, in particular to Guy Barrand.
One plugin represents one C++ class that is a subclass of "PFBase". Each class and subclass is stored in a binary dynamically loadable object file with the extension ".pfp". Each plugin can have inputs and outputs. The inputs are implemented as object member functions whose entry points are published in a list and can be called from other modules. The outputs are just names associated with a list of other plugins and member functions that are called from the (sender) plugin. An input member function takes one argument, a memory pointer, pointing to the data to process. Inputs and outputs are "typed", i.e. they know what kind of data the transfered pointer is pointing to. When the plugins are being connected this type is checked and redirected to a converter function, if necessary.
The plugins are usually grouped in so-called flow kits. The base flow kit, that comes with every distribution, provides just functionality to "play" with the Flow Analyzer, generate some gaussian distributed histograms, add and multiply numbers, fill histograms, and so on. But there exist also flow kits for MIDAS to capture data from experiments running online and offline, and flow kits for particular experiments. Flow kits are actually the "idea" of the Flow Analyzer because they can be extended. The C++ source code has a simple structure that can easily used by a beginner. Work can be distributed and different people can improve different plugins.